1.5.3 ROS Computation Graph
1. Computation Graph Introduction
The previously introduced ROS filesystem describes the storage structure of ROS programs on disk, which is static. However, when ROS programs are running, the relationships between different nodes become complex. ROS provides a practical tool for this: rqt_graph.
rqt_graph can create a dynamic graph displaying the current system operation status. In ROS distributed systems, different processes need to exchange data, and the computation graph can represent this data interaction process as a point-to-point network. rqt_graph is part of the rqt package.
2. Computation Graph Demonstration
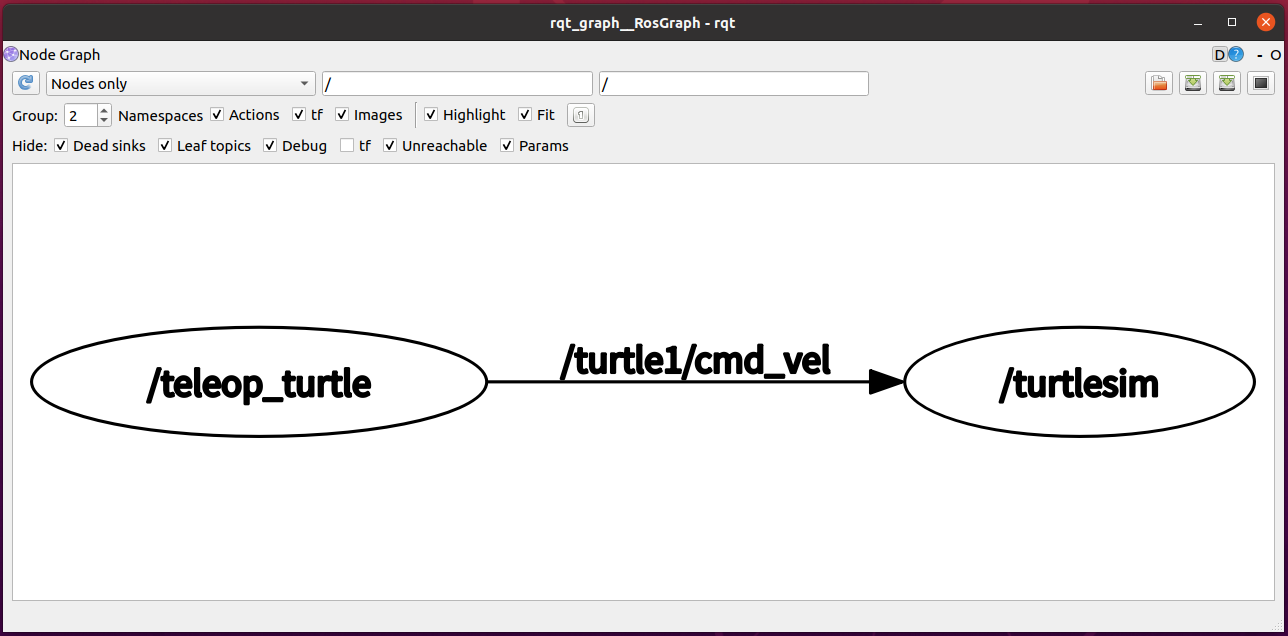
Let's use the built-in ROS turtlesim case to demonstrate the computation graph:
First, run the case as shown in previous instructions
Then, open a new terminal and type: rqt_graph or rosrun rqt_graph rqt_graph
You will see a network topology diagram similar to the one below, which displays the relationships between different nodes: